You are viewing documentation for Kubernetes version: v1.27
Kubernetes v1.27 documentation is no longer actively maintained. The version you are currently viewing is a static snapshot. For up-to-date information, see the latest version.
Third Party Device Metrics Reaches GA
Authors: Renaud Gaubert (NVIDIA), David Ashpole (Google), and Pramod Ramarao (NVIDIA)
With Kubernetes 1.20, infrastructure teams who manage large scale Kubernetes clusters, are seeing the graduation of two exciting and long awaited features:
- The Pod Resources API (introduced in 1.13) is finally graduating to GA. This allows Kubernetes plugins to obtain information about the node’s resource usage and assignment; for example: which pod/container consumes which device.
- The
DisableAcceleratorMetricsfeature (introduced in 1.19) is graduating to beta and will be enabled by default. This removes device metrics reported by the kubelet in favor of the new plugin architecture.
Many of the features related to fundamental device support (device discovery, plugin, and monitoring) are reaching a strong level of stability. Kubernetes users should see these features as stepping stones to enable more complex use cases (networking, scheduling, storage, etc.)!
One such example is Non Uniform Memory Access (NUMA) placement where, when selecting a device, an application typically wants to ensure that data transfer between CPU Memory and Device Memory is as fast as possible. In some cases, incorrect NUMA placement can nullify the benefit of offloading compute to an external device.
If these are topics of interest to you, consider joining the Kubernetes Node Special Insterest Group (SIG) for all topics related to the Kubernetes node, the COD (container orchestrated device) workgroup for topics related to runtimes, or the resource management forum for topics related to resource management!
The Pod Resources API - Why does it need to exist?
Kubernetes is a vendor neutral platform. If we want it to support device monitoring, adding vendor-specific code in the Kubernetes code base is not an ideal solution. Ultimately, devices are a domain where deep expertise is needed and the best people to add and maintain code in that area are the device vendors themselves.
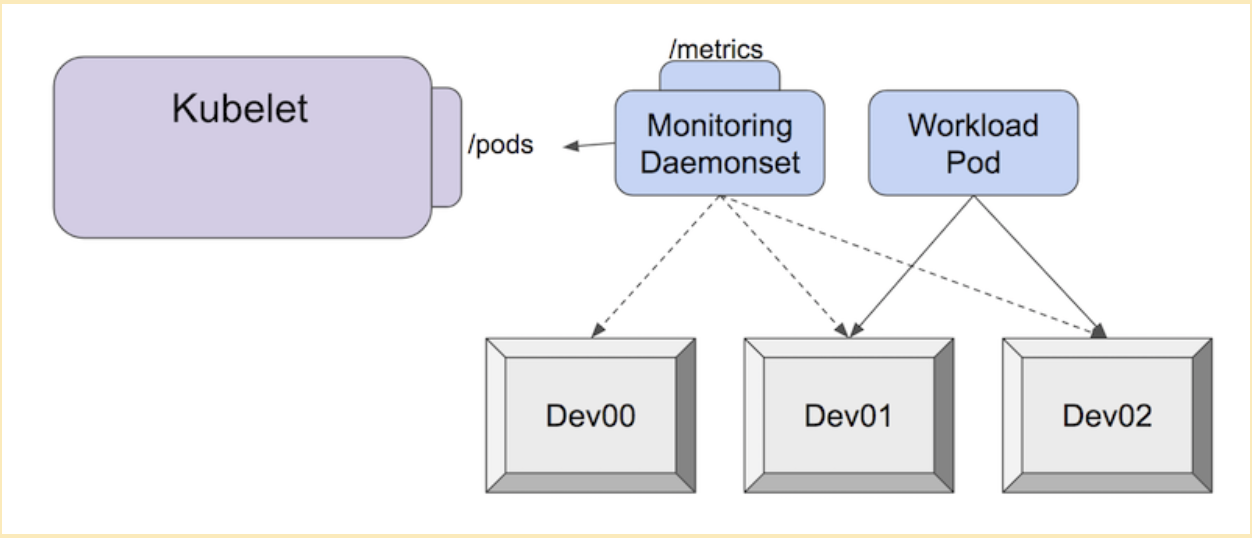
The Pod Resources API was built as a solution to this issue. Each vendor can build and maintain their own out-of-tree monitoring plugin. This monitoring plugin, often deployed as a separate pod within a cluster, can then associate the metrics a device emits with the associated pod that's using it.
For example, use the NVIDIA GPU dcgm-exporter to scrape metrics in Prometheus format:
$ curl -sL http://127.0.01:8080/metrics


# HELP DCGM_FI_DEV_SM_CLOCK SM clock frequency (in MHz).
# TYPE DCGM_FI_DEV_SM_CLOCK gauge
# HELP DCGM_FI_DEV_MEM_CLOCK Memory clock frequency (in MHz).
# TYPE DCGM_FI_DEV_MEM_CLOCK gauge
# HELP DCGM_FI_DEV_MEMORY_TEMP Memory temperature (in C).
# TYPE DCGM_FI_DEV_MEMORY_TEMP gauge
...
DCGM_FI_DEV_SM_CLOCK{gpu="0", UUID="GPU-604ac76c-d9cf-fef3-62e9-d92044ab6e52",container="foo",namespace="bar",pod="baz"} 139
DCGM_FI_DEV_MEM_CLOCK{gpu="0", UUID="GPU-604ac76c-d9cf-fef3-62e9-d92044ab6e52",container="foo",namespace="bar",pod="baz"} 405
DCGM_FI_DEV_MEMORY_TEMP{gpu="0", UUID="GPU-604ac76c-d9cf-fef3-62e9-d92044ab6e52",container="foo",namespace="bar",pod="baz"} 9223372036854775794
Each agent is expected to adhere to the node monitoring guidelines. In other words, plugins are expected to generate metrics in Prometheus format, and new metrics should not have any dependency on the Kubernetes base directly.
This allows consumers of the metrics to use a compatible monitoring pipeline to collect and analyze metrics from a variety of agents, even if they are maintained by different vendors.

Disabling the NVIDIA GPU metrics - Warning
With the graduation of the plugin monitoring system, Kubernetes is deprecating the NVIDIA GPU metrics that are being reported by the kubelet.
With the DisableAcceleratorMetrics feature being enabled by default in Kubernetes 1.20, NVIDIA GPUs are no longer special citizens in Kubernetes. This is a good thing in the spirit of being vendor-neutral, and enables the most suited people to maintain their plugin on their own release schedule!
Users will now need to either install the NVIDIA GDGM exporter or use bindings to gather more accurate and complete metrics about NVIDIA GPUs. This deprecation means that you can no longer rely on metrics that were reported by kubelet, such as container_accelerator_duty_cycle or container_accelerator_memory_used_bytes which were used to gather NVIDIA GPU memory utilization.
This means that users who used to rely on the NVIDIA GPU metrics reported by the kubelet, will need to update their reference and deploy the NVIDIA plugin. Namely the different metrics reported by Kubernetes map to the following metrics:
| Kubernetes Metrics | NVIDIA dcgm-exporter metric |
|---|---|
container_accelerator_duty_cycle |
DCGM_FI_DEV_GPU_UTIL |
container_accelerator_memory_used_bytes |
DCGM_FI_DEV_FB_USED |
container_accelerator_memory_total_bytes |
DCGM_FI_DEV_FB_FREE + DCGM_FI_DEV_FB_USED |
You might also be interested in other metrics such as DCGM_FI_DEV_GPU_TEMP (the GPU temperature) or DCGM_FI_DEV_POWER_USAGE (the power usage). The default set is available in Nvidia's Data Center GPU Manager documentation.
Note that for this release you can still set the DisableAcceleratorMetrics feature gate to false, effectively re-enabling the ability for the kubelet to report NVIDIA GPU metrics.
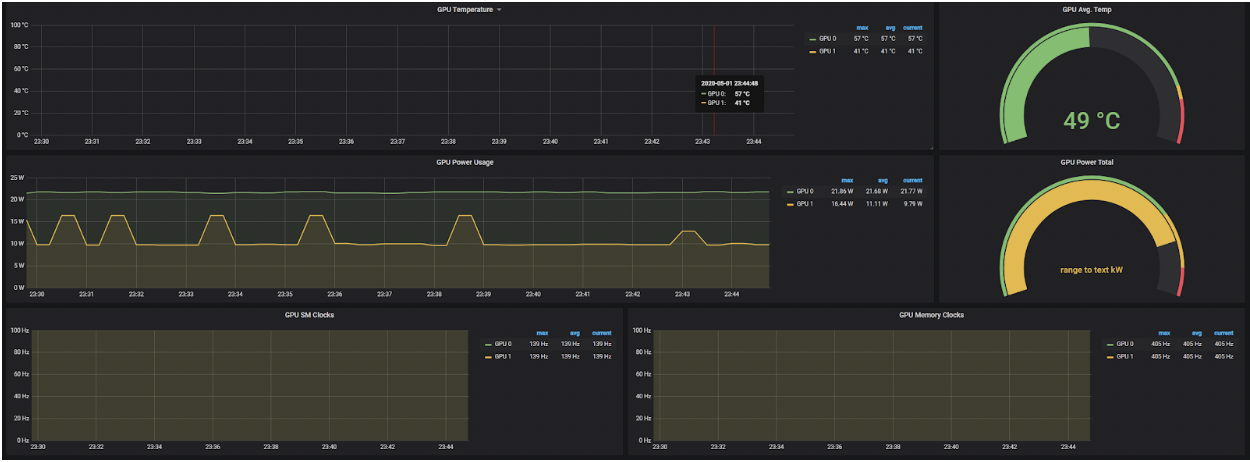
Paired with the graduation of the Pod Resources API, these tools can be used to generate GPU telemetry that can be used in visualization dashboards, below is an example:

The Pod Resources API - What can I go on to do with this?
As soon as this interface was introduced, many vendors started using it for widely different use cases! To list a few examples:
The kuryr-kubernetes CNI plugin in tandem with intel-sriov-device-plugin. This allowed the CNI plugin to know which allocation of SR-IOV Virtual Functions (VFs) the kubelet made and use that information to correctly setup the container network namespace and use a device with the appropriate NUMA node. We also expect this interface to be used to track the allocated and available resources with information about the NUMA topology of the worker node.
Another use-case is GPU telemetry, where GPU metrics can be associated with the containers and pods that the GPU is assigned to. One such example is the NVIDIA dcgm-exporter, but others can be easily built in the same paradigm.
The Pod Resources API is a simple gRPC service which informs clients of the pods the kubelet knows. The information concerns the devices assignment the kubelet made and the assignment of CPUs. This information is obtained from the internal state of the kubelet's Device Manager and CPU Manager respectively.
You can see below a sample example of the API and how a go client could use that information in a few lines:
service PodResourcesLister {
    rpc List(ListPodResourcesRequest) returns (ListPodResourcesResponse) {}
    rpc GetAllocatableResources(AllocatableResourcesRequest) returns (AllocatableResourcesResponse) {}

    // Kubernetes 1.21
    rpc Watch(WatchPodResourcesRequest) returns (stream WatchPodResourcesResponse) {}
}
func main() {
	ctx, cancel := context.WithTimeout(context.Background(), connectionTimeout)
	defer cancel()

	socket := "/var/lib/kubelet/pod-resources/kubelet.sock"
	conn, err := grpc.DialContext(ctx, socket, grpc.WithInsecure(), grpc.WithBlock(),
		grpc.WithDialer(func(addr string, timeout time.Duration) (net.Conn, error) {
			return net.DialTimeout("unix", addr, timeout)
		}),
	)

	if err != nil {
		panic(err)
	}

    client := podresourcesapi.NewPodResourcesListerClient(conn)
    resp, err := client.List(ctx, &podresourcesapi.ListPodResourcesRequest{})
	if err != nil {
		panic(err)
	}
	net.Printf("%+v\n", resp)
}
Finally, note that you can watch the number of requests made to the Pod Resources endpoint by watching the new kubelet metric called pod_resources_endpoint_requests_total on the kubelet's /metrics endpoint.
Is device monitoring suitable for production? Can I extend it? Can I contribute?
Yes! This feature released in 1.13, almost 2 years ago, has seen broad adoption, is already used by different cloud managed services, and with its graduation to G.A in Kubernetes 1.20 is production ready!
If you are a device vendor, you can start using it today! If you just want to monitor the devices in your cluster, go get the latest version of your monitoring plugin!
If you feel passionate about that area, join the kubernetes community, help improve the API or contribute the device monitoring plugins!
Acknowledgements
We thank the members of the community who have contributed to this feature or given feedback including members of WG-Resource-Management, SIG-Node and the Resource management forum!